Case Study · 2020 — 2022
Mile Two
A Dayton based startup, Mile Two offers clients a unique approach to custom software development. At the core of this approach is a process founded in cognitive systems engineering with a focus on full team collaborative design.

While I am unable to share any details of my work on government contracts, I have included information about the process we employ at Mile Two and some examples of artifacts common to the design process.
My Role
Human-centered foundation
Generated and iterated on design concepts, applied cognitive systems engineering principles to complex problems, and produced artifacts that supported informed decision-making.
Stakeholder partnership
Partnered with government stakeholders to gather requirements, prioritize solutions, and balance competing objectives, proactively identifying risk and driving cross-functional alignment.
Community of practice
Established and led a company-wide design community of practice, fostering collaboration across teams and introducing new tools and processes that improved how design work was delivered.
The Process
Cognitive systems engineering keeps the whole team oriented on the work domain, moving from abstract goals to validated design so we don't narrow in on a solution too early.
Discovery
- Knowledge Elicitation
- Observation
- Timelines
Understanding
- Scenarios
- Analogies
- Functional Decomposition
Modeling
- Process Flows
- Journey Maps
Representations
- Mockups
- Sketches
- Design Prototypes
Architecture
- State Transition Diagrams
- Site Map
- Feature Releases
- Development Prototypes
Validation
- Heuristic Evaluation
- Usability Tests
- Demos
- Critique
Functional Decomposition
A Functional Decomposition, also known as a Goal Means Decomposition, is used to identify and map out the various goals of a given domain. By focusing on abstract goals rather than features, we can avoid narrowing in on a design too early in the process.
“In order to achieve <insert goal> we must <insert means>”
The diagram can be read from either direction. For instance, we could read “In order to increase profit, we must increase conversion” or “By increasing conversion, we will increase profit.”
- Increase Profit
- Increase Site Traffic
- Optimize SEO
- Run Targeted Ads
- Decrease Site Abandonment
- Increase Loading Speed
- Reduce Shipping Times
- Increase Conversion
- Reduce Site Friction
- Improve System Architecture
- Simplify Checkout
- Reduce Site Friction
- Increase Average Sale Amount
- Provide Sale Value Based Promotion
- Increase Items Per Transaction
- Suggest Add Ons
- Provide Qty Based Promotion
- Increase Customer Base
- Encourage Customer Return
- Increase Brand Loyalty
- Capture Contact Info
- Gain New Customers
- Incentivize Referrals
- Encourage Customer Return
- Increase Site Traffic
Goal → Means · illustrative example
State Transition Diagram
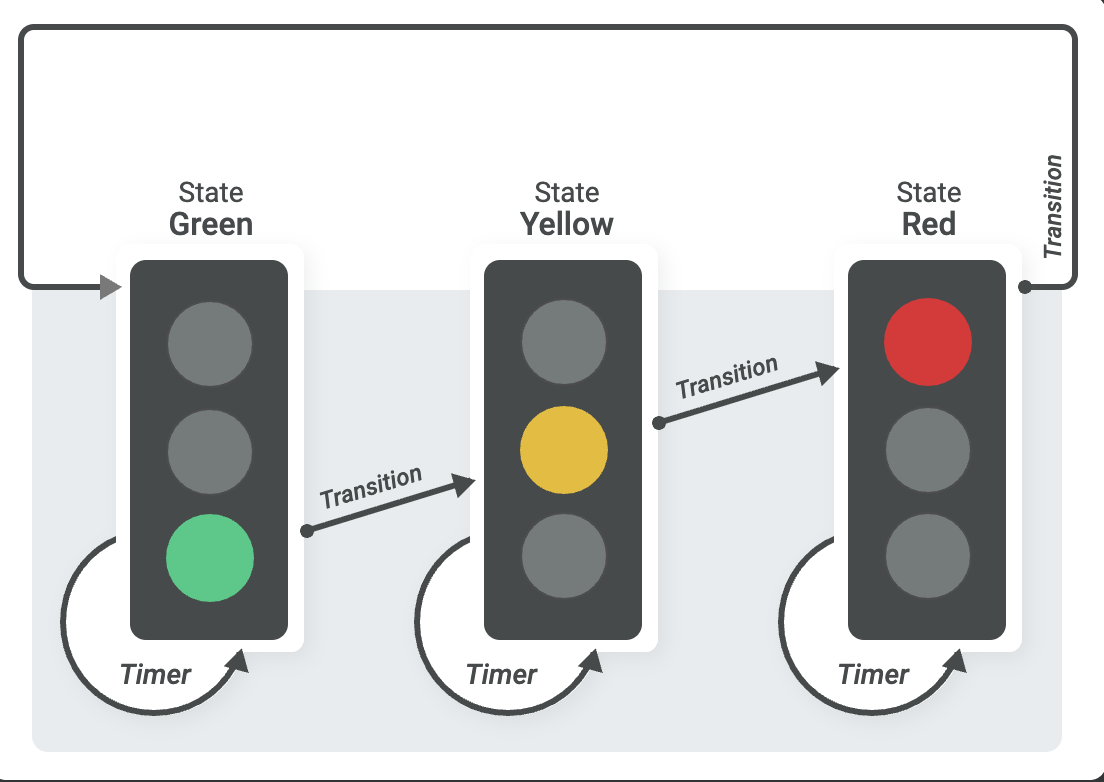
Simply put, a state transition digram shows the states that exist in a given system (or part of a system) and the means of reaching or leaving those states. This type of diagram can be particularly useful in conversation between design, development and quality assurance. The birds eye view of all the states and their interaction within the system aids in identifying gaps and maintaining a logical structure.
The example to the right depicts a state transition diagram for a stoplight. The three states of green, yellow and red cannot be active at the same time. They transition from one to the next after a specified time.